Abstract
Traditional saliency map methods, popularized in computer vision, highlight individual points (pixels) of the input that contribute the most to the model's output. However, in time series, they offer limited insights, as semantically meaningful features are often found in other domains. We introduce Cross-domain Integrated Gradients, a generalization of Integrated Gradients. Our method enables feature attributions in any domain that can be formulated as an invertible, differentiable transformation of the time domain. Crucially, our derivation extends the original Integrated Gradients into the complex domain, enabling frequency-based attributions. We provide the necessary theoretical guarantees, namely, path independence and completeness. We validate our method via controlled experiments with mechanistic analysis, quantitative faithfulness tests, and real-world case studies. Our approach reveals interpretable, problem-specific attributions that time-domain methods cannot capture in three real-world tasks across a variety of model architectures, machine-learning tasks, and cross-domain transforms: frequency-based attribution for a regression task in wearable heart rate extraction, independent component analysis in a classification task for electroencephalography-based seizure detection, and seasonal-trend decomposition for a forecasting problem with a zero-shot time-series foundation model. We release an open-source TensorFlow/PyTorch library to enable plug-and-play cross-domain explainability for time-series models. These results demonstrate the ability of Cross-Domain Integrated Gradients to provide semantically meaningful insights into time-series models that are impossible to achieve with traditional saliency in the time domain.
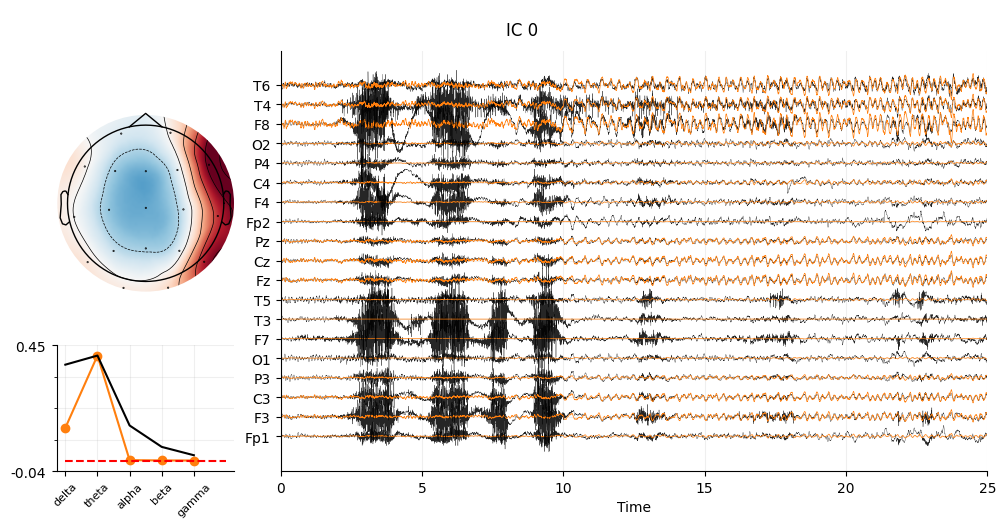
Saliency map visualisation from a seizure detection deep model. Three views : topographic map of the most important component, frequency-band importance, time plot of the most important component (orange) vs input (black).
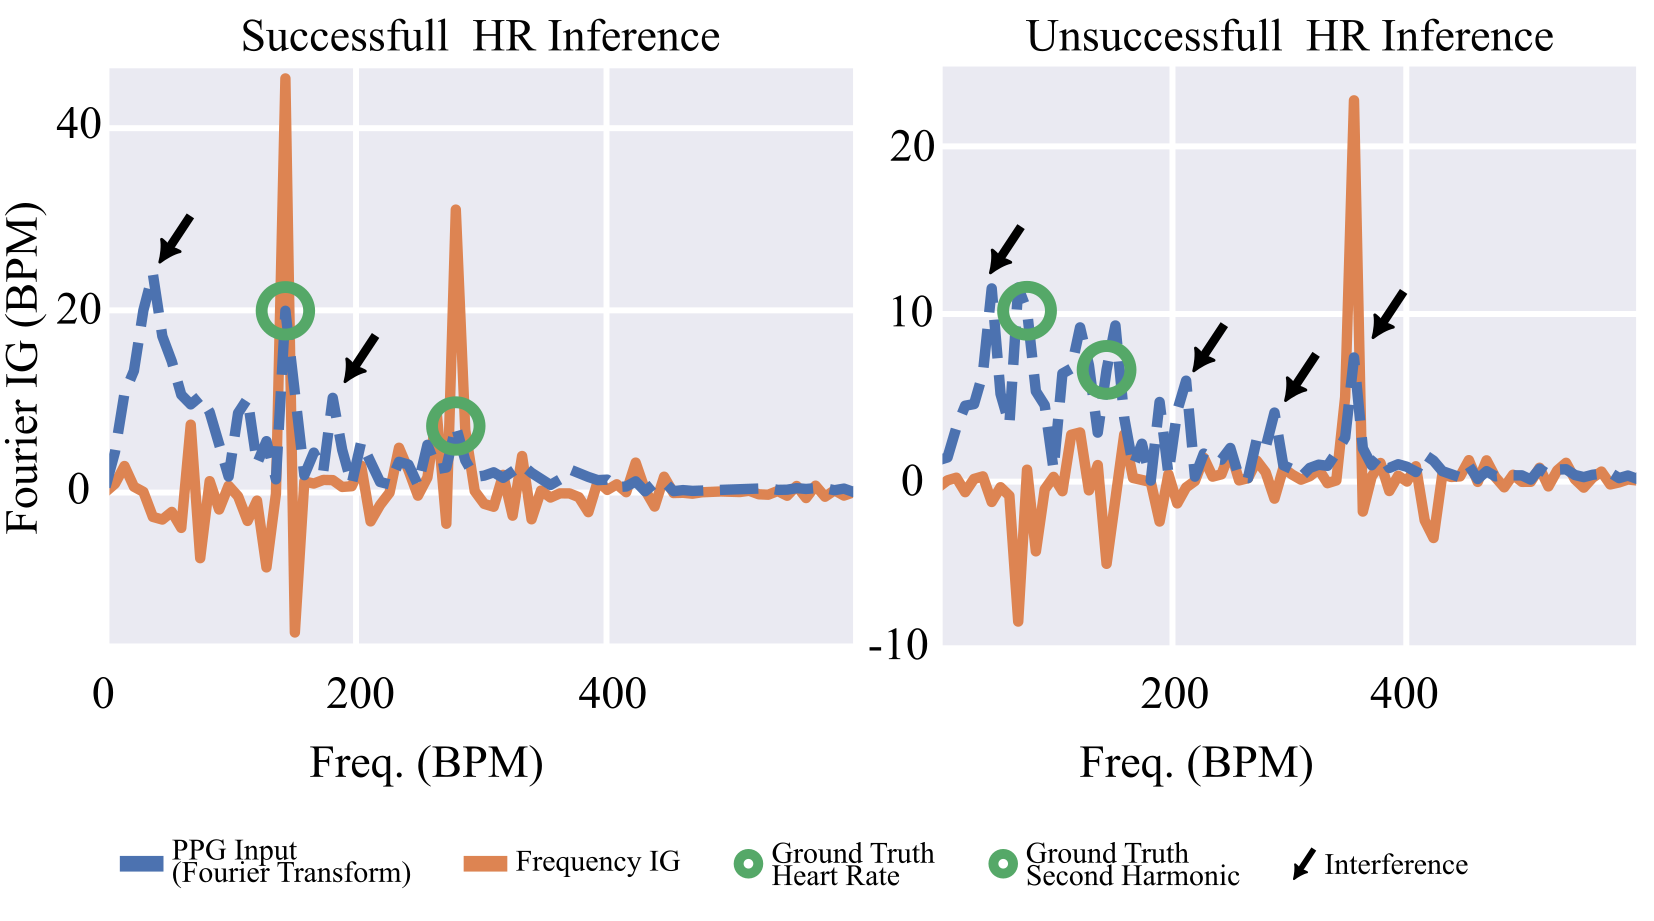
Saliency map visualisation in the frequency-domain. The model process a time-domain photoplethysmography signal and infers heart rate. In the first example (left), the most significant frequency components are heart-related. In the second example (right), the most significant component is an artifact.
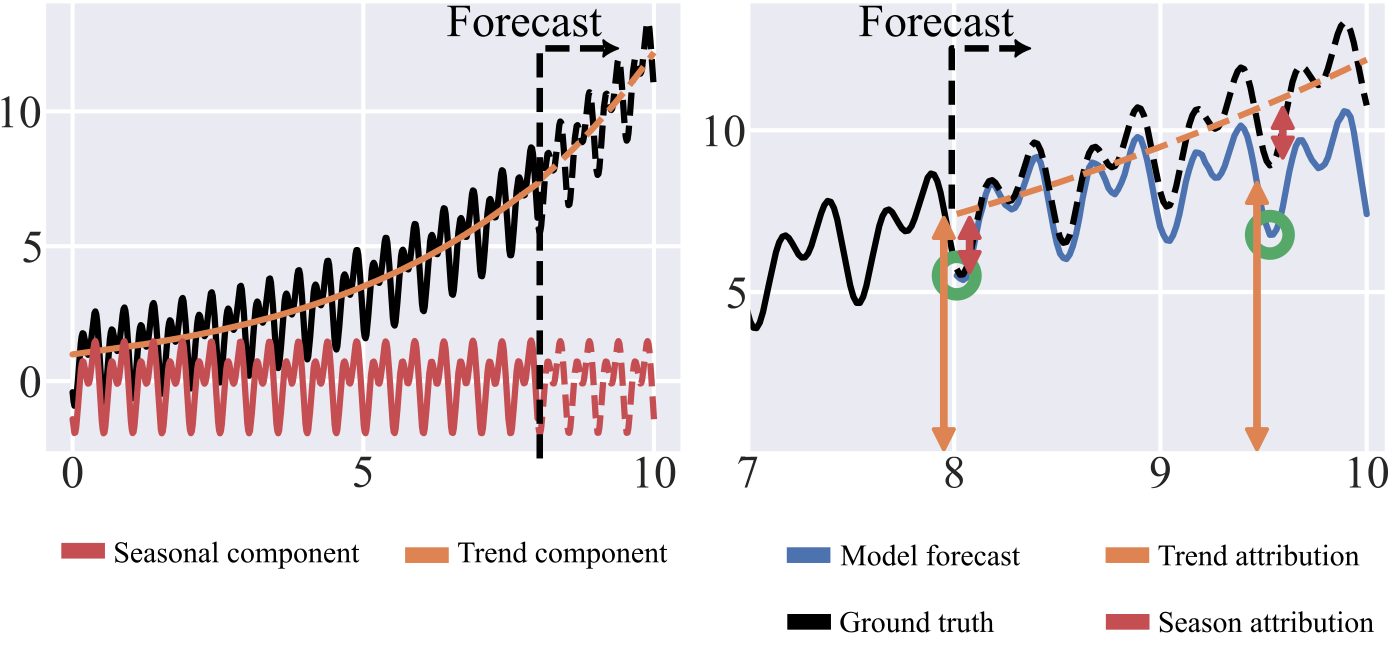
Attribution of TimesFM forecasting to trend and seasonality components.
BibTeX
@article{kechris2025time,
  title={Time series saliency maps: Explaining models across multiple domains},
  author={Kechris, Christodoulos and Dan, Jonathan and Atienza, David},
  journal={arXiv preprint arXiv:2505.13100},
  year={2025}
}